Ontology’s price has soared by over 55%, marking it as one of the top performers in the cryptocurrency market. This surge comes even as major cryptocurrencies like Bitcoin and Ethereum face downturns, propelling ONT to its highest level in six months.
Ontology Price Soars 55% to Six-Month High
Ontology (ONT) has experienced a remarkable price increase of 55%, touching an intraday peak near $0.22, its highest level in six months.
The altcoin had started the day trading at a low of $0.13 but surged to levels not seen since early February 2025. Trading volume surged over 4,600%, exceeding $337 million, highlighting ONT’s standout performance for the day.
While Bitcoin and Ethereum grapple with declines, Ontology’s 24-hour gains have ignited significant interest in the token associated with the decentralized identity protocol.
The growing adoption of AI and blockchain technology has further enhanced interest in Ontology’s infrastructure, which emphasizes data privacy and decentralized identity.
🌐 Community Spotlight 🌐
The age of digital distrust is here.
Deepfakes, fake news & AI threaten our reality.
But there’s hope.
Discover how ONT ID anchors trust in the chaos.
👇https://t.co/a6rUeW6IeJ#AI #Web3 #DecentralizedIdentity
— Community article by @GinolaONT— Ontology – The Trust Layer for Web3 (@OntologyNetwork) August 21, 2025
The project’s emphasis on regulatory compliance for digital identity solutions and blockchain interoperability is pivotal for its adoption trajectory.
Analysts predict that ONT could leverage these trends for further gains.
Ontology Price Forecast: What Does the Technical Picture Indicate?
The dramatic price increase of Ontology while the broader market struggles suggests potential upcoming bearish pressure for holders.
The steep rise in ONT’s value might encounter a pullback, likely towards a demand replenishment zone.
However, open interest in ONT has surged over 617%, nearing $60 million, indicating trader confidence and speculative interest amid the token’s upward trajectory.
Ontology’s price outlook, buoyed by increasing open interest and substantial trading volumes, hints at possible continued gains.
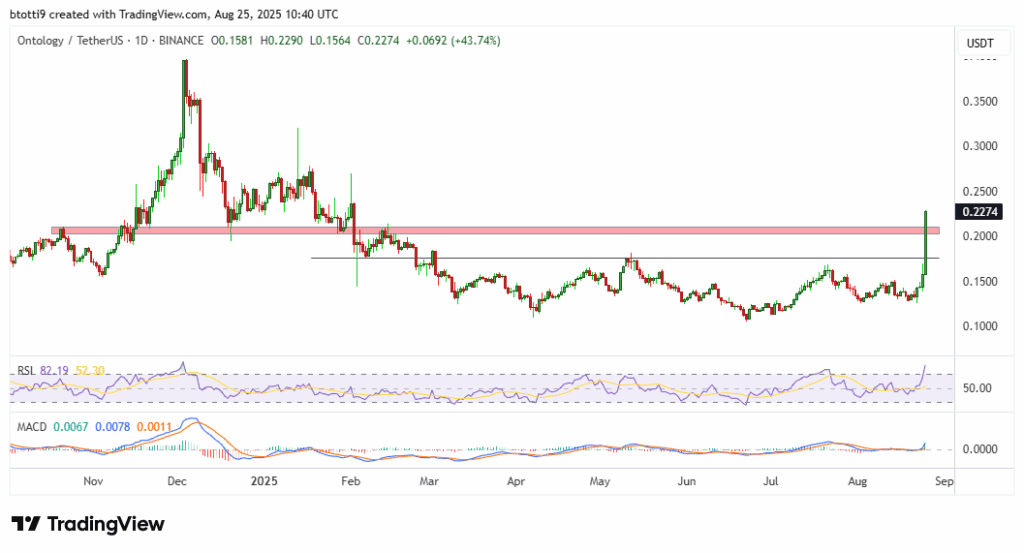
Price chart for ONT from TradingView
Technically, ONT is trading at an 81 on the daily Relative Strength Index (RSI), which indicates the asset is firmly in overbought territory, suggesting a potential reversal.
However, the Moving Average Convergence Divergence (MACD) indicates a bullish crossover, showing that bullish momentum remains, and a sustained rally can still occur if buyers establish a base at critical support levels.
These support zones on the daily chart are around $0.20 and $0.17.
Conversely, a breakout above $0.27 would enable buyers to target $0.40.

Meet William, a proud Bethel University alumnus with a fervent passion for lifestyle and culture topics. His keen interest doesn’t stop there; he’s also deeply engrossed in current events of all kinds. William dedicates himself wholeheartedly to this site, thriving on the collaborative energy he shares with Suzanne, his long-standing partner in crime.
Having navigated their university courses side by side for years, their teamwork on the site is nothing short of dynamic. Together, they bring a unique blend of insights, proving that two heads are indeed better than one in delivering compelling content.